1.9 KiB
1.9 KiB
Radiacode Monitor
This project provides a real-time monitoring dashboard for a Radiacode gamma spectrometer. It processes live radiation data, stores it in a SQLite database, and serves an updated JSON payload for a web-based frontend.
Features
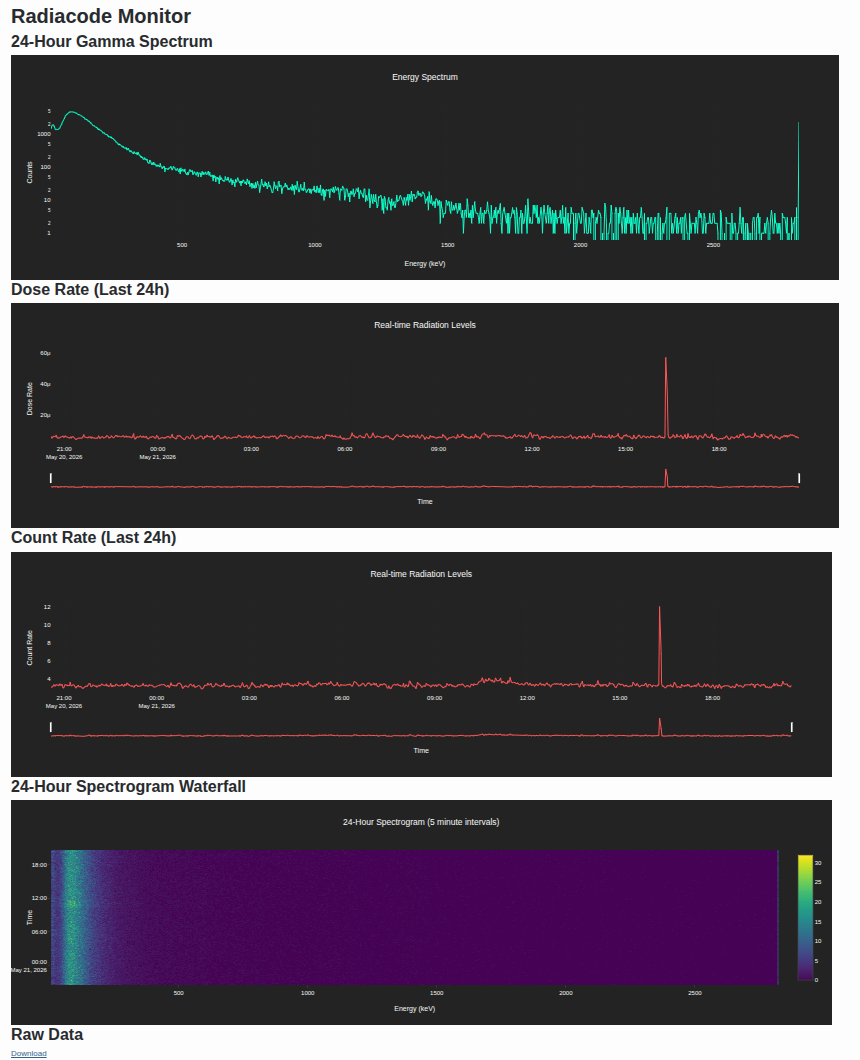
- Real-time Monitoring: Displays live dose rate and count rate trends.
- Energy Spectrum: Shows the accumulated gamma energy spectrum (keV).
- 24-Hour Spectrogram: A heatmap waterfall view of the radiation spectrum at 5-minute intervals over the last 24 hours.
- Data Persistence: Uses SQLite to store historical radiation data.
- Web Dashboard: A lightweight HTML/JavaScript frontend using Plotly for interactive charting.
File Structure
rc_read2.py: The main Python script that interfaces with the Radiacode device, processes data, and updates the database and web JSON.frontend.htm: The web dashboard displaying the charts.radiacode_data.db: SQLite database containing historical spectrum and rate data.live_spectrum.json: Aggregated JSON data used by the frontend.
Setup and Usage
-
Prerequisites:
- A Radiacode device connected to the system.
- Python 3 with
sqlite3and theradiacodewrapper library installed.
-
Running the Monitor: Execute the Python script to start the data collection loop:
python rc_read2.py -
Viewing the Dashboard: The dashboard is designed to be served via a web server (like Apache) that can access the
live_spectrum.jsonfile. Point your web server to the directory containingfrontend.htm.
Data Processing
- Intervals: The script polls for spectrum data every 5 minutes and performs a hardware reset to ensure clean window alignment.
- Aggregation: The
update_web_jsonfunction downsamples the last 24 hours of rate data and aggregates spectrum counts to keep the JSON payload size manageable for the web frontend.